The Complete Introduction to R Programming Bundle for $49
February 23, 2017 / by Marco / Categories : Business, deals, design, entrepreneur, website


KEY FEATURES
It seems like everything these days is driven by data, and statisticians and analysts across industries need to handle this data efficiently and tactfully. That’s where R comes in, a powerful programming language that helps developers solve even the most complex data problems. Data scientists are in constant demand, and this extensive course will give you your first taste of R, enabling you to make statistical inferences and run programs that solve important data problems and turn heads.
- Access 50 lectures & 3.5 hours of content 24/7
- Get introduced to the R Studio & programming concepts like variables, vectors, arrays, loops, & matrices
- Visualize data using R’s base graphics
- Learn the fundamentals of univariate & bivariate analysis, computing confidence intervals, interpreting p values, & working w/ statistical tests
- Perform a full-scale data analysis project
PRODUCT SPECS
Details & Requirements
- Length of time users can access this course: lifetime
- Access options: web streaming, mobile streaming
- Certification of completion not included
- Redemption deadline: redeem your code within 30 days of purchase
- Experience level required: all levels
Compatibility
- Internet required
THE EXPERT
Selva Prabhakaran is a data scientist with a large E-commerce organization. In his 7 years of experience in data science, he has tackled complex real-world data science problems and delivered production-grade solutions for top multinational companies. Selva lives in Bangalore with his wife.

KEY FEATURES
R is one of the top rising tools in the analytics world. At its core, R is a statistical programming language that provides excellent tools for data mining and analysis, but it also has high-level graphics and machine learning capabilities. In this course, you’ll learn how to harness those graphics techniques to represent complex sets of data in inspiring ways.
- Access 31 lectures & 2 hours of content 24/7
- Create basic plots like histograms, scatterplots & more
- Import data in R from popular formats like CSV & Excel tables
- Build a complete website to import & plot data
- Learn how to the Shiny package to create fully-featured web pages directly from the R console
PRODUCT SPECS
Details & Requirements
- Length of time users can access this course: lifetime
- Access options: web streaming, mobile streaming
- Certification of completion not included
- Redemption deadline: redeem your code within 30 days of purchase
- Experience level required: all levels
Compatibility
- Internet required
THE EXPERT
Dr. Fabio Veronesi obtained a PhD in digital soil mapping from Cranfield University and then moved to Zurich, where he has been working for the past three years as a postdoc at ETH. There, he is working on Geoinformation topics, ranging from the application of mathematical techniques to the improvement of shaded relief representations to the use of machine learning to increase the accuracy of wind speed maps.
During his PhD, he needed to learn a programming language, because commercial applications did not provide the ideal platforms to pursue his research work. Since R has a series of packages created specifically for the application of statistical techniques to soil science, he decided to teach himself this powerful language. Since then, he has been using R every day for his work.

KEY FEATURES
R is an ideal tool for organizing and graphing huge datasets, which is especially valuable to businesses that handle a lot of users and financial details on a daily basis. In this beginner’s course to R graphics you’ll get a solid grounding in the “base” graphics package in R, as well as more sophisticated packages like lattice and ggplot2. By course’s end, you’ll be ready to extend your R knowledge to more advanced levels.
- Access 41 lectures & 2 hours of content 24/7
- Understand the basic functionality of R graphs
- Explore different types of graphs for visualizing different types of variables
- Cover bivariate plots, time series, & high dimensional plots
- Learn the tips & tricks to the most efficient ways of drawing various types of graphs
PRODUCT SPECS
Details & Requirements
- Length of time users can access this course: lifetime
- Access options: web streaming, mobile streaming
- Certification of completion not included
- Redemption deadline: redeem your code within 30 days of purchase
- Experience level required: all levels
Compatibility
- Internet required
THE EXPERT
Ehsan Karim is a statistics Ph.D. candidate at the University of British Columbia. His current research interest is in the methods that deal with time-dependent confounding in longitudinal observational studies. Additionally, he is interested in software implementation of methods related to causal inference. He has been a user of R for more than 15 years, and has more than 5 years of experience in teaching various statistical software packages.

KEY FEATURES
Ggplot2 is one of R’s most popular packages, and is an implementation of the grammar of graphic in R. In this course, you’ll move beyond the basic, default graphics offered by R and shows you how to create more advanced and publication-ready plots. Soon enough, you’ll be separating from other data job seekers with more sophisticated and interactive graphing abilities.
- Access 40 lectures & 2 hours of content 24/7
- Start making elegant & publication-ready plots by learning ggplot2
- Build statistical plots layer by layer
- Understand how to combine elements to make new graphics
- Customize your graphs & make interactive web pages to present your work or analyze your data
PRODUCT SPECS
Details & Requirements
- Length of time users can access this course: lifetime
- Access options: web streaming, mobile streaming
- Certification of completion not included
- Redemption deadline: redeem your code within 30 days of purchase
- Experience level required: all levels
Compatibility
- Internet required
THE EXPERT
Christophe Ladroue has many years of experience in machine learning and statistics. Most of his work has been focused on developing tools for the analysis of biological data, from genetics to physiology, and his scientific publications span from medical journals to pure statistics. He has used and has been teaching R and ggplot2 for a few years and he occasionally posts related articles on his personal blog: http://chrisladroue.com/blog/

KEY FEATURES
As the world continues to generate more and more data at a faster pace, the demand for data mining – generating new information by examining large databases – is growing rapidly as well. R is one of the top tools for data mining, and although data mining is a very broad topic, this course will get you up to speed with the mathematical basics. Once you’ve got that, you’ll be able to directly apply your knowledge to working to solve real-world problems with R.
- Access 30 lectures & 2.5 hours of content 24/7
- Understand the mathematical basics of data mining & working w/ algorithms
- Learn how to solve real-world data mining problems
- Explore the different disciplines of data mining & the algorithms within them
PRODUCT SPECS
Details & Requirements
- Length of time users can access this course: lifetime
- Access options: web streaming, mobile streaming
- Certification of completion not included
- Redemption deadline: redeem your code within 30 days of purchase
- Experience level required: all levels
Compatibility
- Internet required
THE EXPERT
Romeo Kienzler is a Chief Data Scientist at the IBM Watson IoT Division. In his role, he is involved in international data mining and data science projects to ensure that clients get the most out of their data. He works as an Associate Professor for data mining at a Swiss University and his current research focus is on cloud-scale data mining using open source technologies including R, ApacheSpark, SystemML, ApacheFlink, and DeepLearning4J. He also contributes to various open source projects. Additionally, he is currently writing a chapter on Hyperledger for a book on Blockchain technologies.

KEY FEATURES
This enormous book will take you on a complete journey with the R programming language and its many applications to data analysis. Over five connected modules, you’ll dive into statistical reasoning, graphing with R, data mining, the quantitative finance concepts of R, and its machine learning capabilities. Across these lessons, you’ll have a fully-fledged, nuanced understanding of the many professional applications of R.
- Access 1,738 pages 24/7
- Describe & visualize the behavior of data & relationships between data
- Handle missing data gracefully using multiple imputation
- Create diverse types of bar charts using the default R functions
- Familiarize yourself w/ algorithms written in R for spatial data mining, text mining, & more
- Harness the power of R to build machine learning algorithms w/ real-world data science applications
- Learn specialized machine learning techniques for text mining, big data, & more
PRODUCT SPECS
Details & Requirements
- Length of time users can access this course: lifetime
- Access options: web streaming, mobile streaming
- Certification of completion not included
- Redemption deadline: redeem your code within 30 days of purchase
- Experience level required: all levels
Compatibility
- Internet required
THE EXPERT
Packt’s mission is to help the world put software to work in new ways, through the delivery of effective learning and information services to IT professionals. Working towards that vision, it has published over 3,000 books and videos so far, providing IT professionals with the actionable knowledge they need to get the job done–whether that’s specific learning on an emerging technology or optimizing key skills in more established tools.

KEY FEATURES
Machine learning is one of the most important new frontiers in technology, and the R programming language is one of the best ways to optimize machine learning to solve a diverse range of challenges. Starting with a refresher in R, and then delving into real world problems, this course introduces you to an exciting new way to glean information and answer questions with R.
- Access 1,123 pages 24/7
- Implement R machine learning algorithms from scratch
- Solve real-world problems using machine learning algorithms
- Write reusable code & build complete machine learning systems from the ground up
- Evaluate & improve the performance of machine learning models
- Learn specialized machine learning techniques for text mining, social network data, big data, & more
PRODUCT SPECS
Details & Requirements
- Length of time users can access this course: lifetime
- Access options: web streaming, mobile streaming
- Certification of completion not included
- Redemption deadline: redeem your code within 30 days of purchase
- Experience level required: all levels
Compatibility
- Internet required
THE EXPERT
Packt’s mission is to help the world put software to work in new ways, through the delivery of effective learning and information services to IT professionals. Working towards that vision, it has published over 3,000 books and videos so far, providing IT professionals with the actionable knowledge they need to get the job done–whether that’s specific learning on an emerging technology or optimizing key skills in more established tools.

KEY FEATURES
One of the most important things any good data science expert or analyst must know how to do is creative intelligent visualizations. Through this book, you’ll learn how to effectively design and present large amounts of data to demonstrate key insights. You’ll learn how to visualize with HTML5, JavaScript, and D3, three of the top technologies for creating interactive visualizations on the web.
- Harness the power of D3 by building interactive & real-time data-driven web visualizations
- Find out how to use JavaScript to create compelling visualizations of social data
- Apply critical thinking to visualization designs & get intimate w/ your dataset to identify its potential visual characteristics
- Explore the various features of HTML5 to design creative visualizations
- Discover what data is available on Stack Overflow, Facebook, Twitty, & Google+
PRODUCT SPECS
Details & Requirements
- Length of time users can access this course: lifetime
- Access options: web streaming, mobile streaming
- Certification of completion not included
- Redemption deadline: redeem your code within 30 days of purchase
- Experience level required: all levels
Compatibility
- Internet required
THE EXPERT
Packt’s mission is to help the world put software to work in new ways, through the delivery of effective learning and information services to IT professionals. Working towards that vision, it has published over 3,000 books and videos so far, providing IT professionals with the actionable knowledge they need to get the job done–whether that’s specific learning on an emerging technology or optimizing key skills in more established tools.

Marco / admin / 30 Nov
Writing day to day ramblings about making money, business, technology, sharing awesome deals and everything else that I know I'll forget. Follow my personal blog https://marcotran.com.au
I've recently also turned Vegan and started this website Veggie Meals - check it out
"When technology speaks for itself, that is art" - MT
Affiliate Compensated: there are some articles with links to products or services that I may receive a commission.
OTHER ARTICLES YOU MAY LIKE

REVIEWING AND UNBOXING THE TOOCKI USB-C RIGHT ANGLE 1.2M CABLE
USB C cables are among the most ordinary accessories we own, yet they can make a surprisingly noticeable difference to how comfortable our devices are to use while charging. The Toocki USB C right angle cable is a good example of a simple accessory that tries to solve a very common irritation, because instead of […]
read more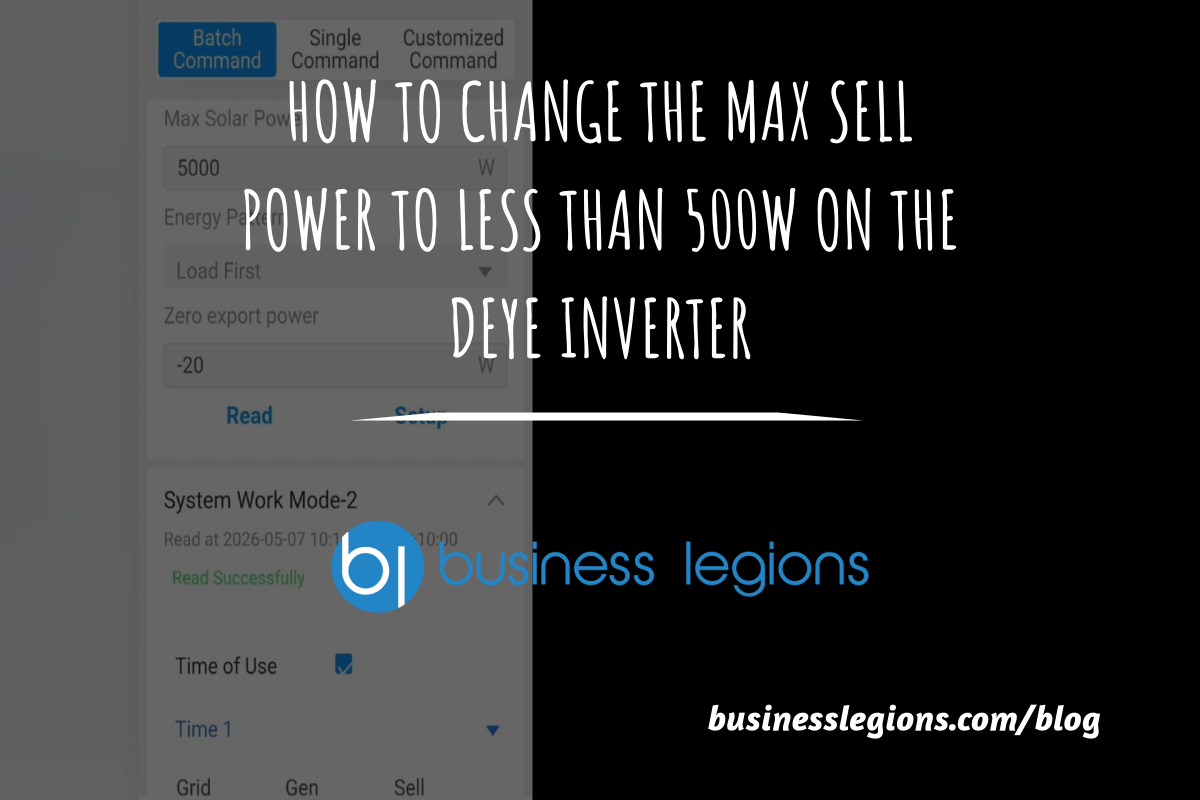
QUICK FIX TO CHANGE THE MAX SELL POWER TO LESS THAN 500W ON THE DEYE INVERTER
There are many reasons a home owner or installer might want to place a tight cap on how much solar power is exported to the public grid. Some households live under a strict export cap imposed by their local distribution network operator, others want to reduce export to focus on self consumption and battery charging, […]
read more